
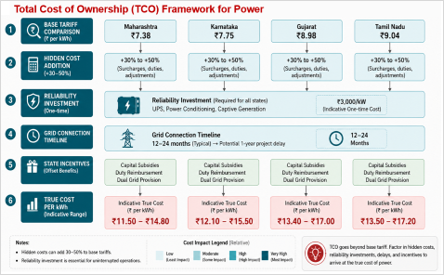
Indian manufacturing has reached a turning point unlike any before it. With the India Semiconductor Mission having cleared 10 projects worth ₹1.60 lakh crore and an automotive industry pegged at $250 billion in 2025, the country is setting itself up as the world’s go-to manufacturing alternative under the “China Plus One” playbook. The states are scrambling over one another to land these mega-investments; Maharashtra lately staked a claim to the cheapest industrial electricity in the country at ₹7.38 a unit, slipping in below Gujarat at ₹8.98, Tamil Nadu at ₹9.04, and Karnataka at ₹7.75.
However, beneath these headline tariff announcements lies a more complex reality that strategic investors must navigate. What industrial electricity actually costs once it lands can run 30 to 50% above the quoted tariff, the result of a stacked-up architecture of cross-subsidy surcharges, electricity duties, wheeling charges, and fuel-cost adjustments, none of which jumps out at you in the first round of investment sums. Understanding this hidden cost structure is critical for semiconductor and automotive manufacturers, where power consumption can constitute 25-30% of operational expenditure and reliability directly impacts production yields.
State-wise Industrial Power Tariff Landscape
The industrial power tariff landscape in India has undergone significant transformation as states compete for manufacturing investments. Maharashtra, long carrying a reputation for steep electricity costs, is recasting itself through bold tariff reform. Chief Minister Devendra Fadnavis has said the state will bring industrial tariffs down from ₹8.32 to ₹7.38 a unit, which would make it the most competitive of the big industrial states. The cut is part of a wider move to a Merit Order Dispatch system, one that lets the state buy from private suppliers at cheaper rates.
Gujarat, for years a favoured manufacturing base thanks to its surplus power and industrial backbone, is holding industrial tariffs at ₹8.98 a unit right now. The Gujarat Electricity Regulatory Commission has put out Multi-Year Tariff Regulations that run through 2030, giving the kind of long-range tariff clarity that takes some of the guesswork out of investing. Karnataka went the other way at first, raising tariffs for 2025-26, then turned around and trimmed industrial rates by 6.8% to ₹7.75 a unit to hold on to customers who were drifting toward private power through open access. Tamil Nadu carries the highest headline rate of the major manufacturing states at ₹9.04 a unit, yet the investment keeps coming, drawn by its well-rooted automotive ecosystem and a skilled workforce.
The following table presents a comparative overview of industrial power tariffs across key manufacturing states:
| State | Industrial Tariff (₹/kWh) | Tariff Trend | Key Regulatory Feature |
| Maharashtra | 7.38 (proposed) | Decreasing | Merit Order Dispatch system |
| Karnataka | 7.75 | Decreasing | Open access friendly policies |
| Gujarat | 8.98 | Stable | MYT Regulations until 2030 |
| Tamil Nadu | 9.04 | Stable | Established industrial ecosystem |
| Andhra Pradesh | ~8.15 | Variable | Competitive renewable integration |
However, these headline figures represent only the base energy charges. The actual cost of power procurement involves multiple additional layers that significantly impact the total cost of ownership.
The Hidden Cost Architecture
Beyond the per-unit energy charges, industrial consumers in India face a complex web of levies and surcharges that inflate the final electricity bill. Understanding these components is essential for accurate financial modeling.
Cross-Subsidy Surcharge (CSS): This is perhaps the most significant hidden cost for large industrial consumers. The CSS is levied when industrial consumers procure power through open access instead of the local distribution company (DISCOM). Currently, this surcharge can increase the cost of imported power by 25-40% if not properly planned. The Karnataka Electricity Regulatory Commission has proposed reducing cross-subsidy and cross-subsidy surcharge from FY 2029, with a roadmap to keep both subsidizing and subsidized categories within the ±20% band as mandated by the Tariff Policy.
Electricity Duty: State governments levy electricity duty on industrial consumption, with rates varying significantly across states. Maharashtra charges 9-16% for industrial consumers, while Gujarat applies 15% on commercial establishments. Karnataka levies 9% on industrial units. These duties are calculated on the assessed charges and can add substantially to the overall power cost.
Fixed Charges and Demand Charges: Industrial consumers with high-tension connections face fixed charges based on connected load or contract demand, typically ranging from ₹40 to ₹130 per month depending on the state and connection capacity. Additionally, demand charges are levied based on maximum demand recorded, with Maharashtra charging ₹555 per kVA per month for HT industrial and commercial consumers. These charges apply regardless of actual consumption, creating a base cost that must be factored into unit economics even during production ramp-down periods.
Wheeling Charges: For consumers procuring power through open access or from sources other than the local DISCOM, wheeling charges apply for using the transmission and distribution infrastructure. These charges typically range from ₹0.25 to ₹0.40 per unit and are regulated by the Central Electricity Regulatory Commission. The Electricity (Amendment) Rules, 2026 have brought additional clarity to these charges but also introduced new compliance requirements.
Fuel Cost Adjustment (FCA): Power tariffs incorporate fuel cost adjustments that are applied uniformly across all time-of-day slots. These adjustments range from ₹0.28 to ₹0.55 per unit depending on the state’s generation mix and are revised periodically based on actual fuel costs. This creates tariff volatility that can significantly impact operational budgeting.
Time-of-Day (ToD) Tariffs: Since April 2024, commercial and industrial consumers with maximum demand exceeding 10 kW operate under ToD tariff structures. Peak hour charges can be 15-20% higher than standard rates, while off-peak hours offer discounts. For semiconductor and automotive manufacturing, which require continuous operations, this creates additional cost pressure as production cannot be easily shifted to off-peak hours.
When these components are aggregated, the landed cost of power for an industrial consumer can be 30-50% higher than the quoted per-unit tariff. For a semiconductor fab consuming 100 megawatt-hours per hour, this differential translates to crores of rupees in additional annual expenditure.
Industry-Specific Power Requirements
The energy intensity of semiconductor manufacturing and automotive production necessitates a deeper analysis of power requirements beyond standard industrial consumption patterns.
Few manufacturing operations anywhere in the world burn through energy the way a semiconductor fab does. A large fab can draw as much as 100 megawatt-hours every single hour, which is roughly what 80,000 households would use. The work demands heavy, unbroken power just to hold cleanrooms at the right state, keep tools hot, and carry the silicon through processing. And the further the technology pushes ahead, the steeper the energy bill climbs. Extreme Ultraviolet lithography, for one, can pull up to ten times the electricity of the older lithography tools. Worldwide, the semiconductor industry takes up somewhere near 0.3% of all electricity used, and that figure is set to rise as India builds out more of its own capacity.
Vehicle manufacturing does not sit at the same extreme, yet it carries real power-cost pressure of its own. Turning out an ordinary passenger car takes about 41.8 megajoules of energy for every kilogram of vehicle. With Indian auto output expanding at close to 15% a year, and electric vehicles adding their own energy load on the battery side, the sector’s total draw on the grid is on track to climb sharply.
Then there is the matter of power quality, which loads on a cost all its own. A fab needs “six nines” reliability, 99.9999%, from its supply, because a single outage or even a voltage dip can throw operations off and ruin whole batches of chips. Meeting that bar means spending on UPS systems, power-conditioning gear, and very often a captive generation setup as well. The money sunk into all that backup, plus what it costs to keep running, has to be counted as part of the true cost of owning your power.
Strategic Implications and Mitigation Strategies
For investors and manufacturing planners, the layered cost structure of industrial electricity in India necessitates a total cost of ownership (TCO) approach rather than a simple tariff comparison.
Captive Power Generation: Many large manufacturing facilities are evaluating captive power plants (CPPs) as an alternative to grid power. The India Captive Power Plant market is projected to reach USD 28.85 billion by 2025, with industrial users finding CPP power approximately 30% cheaper on a per-unit basis compared to DISCOM tariffs. However, the capital expenditure for establishing a captive plant, estimated at approximately ₹3,000 per kW, requires careful financial modeling against the long-term grid power costs.
Renewable Energy Integration: States like Gujarat, Karnataka, and Tamil Nadu have made significant strides in renewable energy integration, offering green power tariffs and renewable energy open access. The Draft National Electricity Policy 2026 proposes exempting manufacturing industries, railways, and Metro systems from cross-subsidy surcharges, which could significantly improve the economics of renewable energy procurement for large consumers.
State Incentive Structures: Beyond headline tariffs, states offer various incentive packages that can offset power costs. These include capital subsidies for establishing manufacturing units, reimbursement of electricity duty for specific sectors, and dedicated power infrastructure for industrial parks. For instance, the Uttar Pradesh government offers dual power grid provision for semiconductor fab units, with the state government reimbursing the cost of one grid while the investor bears the cost of the second.